Left unchecked, that vibration causes bearing failures, cracked drywall, blown compliance limits, and expensive claims from neighboring property owners. Many operations teams and project managers struggle with the same question: how do you catch a problem before it becomes a shutdown, a lawsuit, or a safety incident?
Vibration analysis is the answer. In manufacturing settings, businesses that lean on predictive maintenance techniques (vibration monitoring among them) see 52.7% less unplanned downtime and 78.5% fewer defects than plants relying mainly on reactive repairs, according to NIST's 2021 manufacturing maintenance survey.
This guide covers what vibration analysis is, the core techniques behind it, a step-by-step process you can apply in the field, and how monitoring systems make it all more manageable.
Key Takeaways
- Catch equipment faults and ground-vibration risks before failures, claims, or violations.
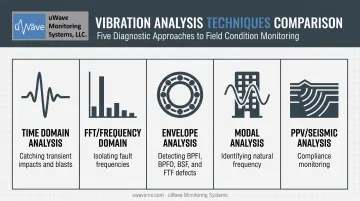
- Apply five core techniques: time domain, FFT, envelope, modal, and PPV/seismic analysis.
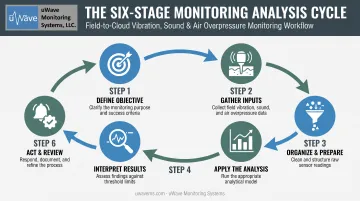
- Use a six-step process to keep results consistent, defensible, and action-ready.
- uWave's Instantel field-to-cloud systems turn data into real-time alerts and audit-ready reports.
What Is Vibration Analysis?
Vibration analysis is the measurement and interpretation of oscillatory motion to assess the condition of machinery, structures, or the ground itself. The same discipline covers two distinct applications.
Machine condition monitoring looks at rotating and reciprocating equipment, such as pumps, turbines, and gearboxes, hunting for early signs of imbalance, misalignment, or bearing wear.
Ground-borne and structural vibration monitoring tracks how construction activity, blasting, or transit operations affect nearby structures and infrastructure. This is the world of pile driving, quarry blasts, and tunnel boring.
Both branches share common approaches:
- Time-domain vs. frequency-domain analysis: raw waveform review versus spectrum-based fault isolation
- Continuous vs. periodic monitoring: always-on sensors versus scheduled spot checks
- Manual vs. automated systems: handheld analyzers versus remote, sensor-based platforms that transmit data automatically
The right combination depends on what you're trying to protect and how much risk you can tolerate.
Why Vibration Analysis Is Critical
Vibration analysis protects equipment uptime while keeping people, structures, and budgets safe. Skip it, or rely on outdated spot-check methods, and you risk missing faults early enough to act, exceeding regulatory vibration limits, or damaging a structure you had no idea was at risk.
A 2023 Bureau of Reclamation report ties the Sayano-Shushenskaya hydro-unit failure, which killed 75 people and damaged ten 640 MW units, to vibration and pressure warning signs that went unaddressed. That single incident is why Reclamation now mandates vibration monitoring across all its hydroelectric synchronous machines.
Consistent vibration analysis:
- Improves decision quality around maintenance scheduling and construction activity
- Reduces risk of equipment failure, structural damage, and safety incidents
- Increases efficiency by catching issues early instead of reacting after the fact
- Supports regulatory compliance for blasting, pile driving, and heavy equipment near sensitive structures
- Enables data-backed planning for long-term asset care and project scheduling
Regulation makes analysis non-negotiable in many settings. Federal rule 30 CFR 816.67 requires surface-mine operators to control ground vibration specifically to prevent injury and off-permit property damage. In those jurisdictions, vibration analysis is the price of doing business.
Core Vibration Analysis Techniques Explained
Different techniques answer different questions. A bearing fault and a blast-induced ground wave look nothing alike on paper, so picking the right method depends on what you're monitoring and what you need to learn from it.
Time Domain Analysis
Time domain analysis examines the raw waveform, amplitude plotted against time, exactly as the sensor recorded it. This is where you catch transient events: impacts, shocks, and blast pulses that happen in an instant.
Construction and blasting teams rely on this heavily. A three-channel seismograph records particle velocity versus time across three perpendicular axes simultaneously. Millisecond-delay blast events typically last 1–2 seconds, while impact pile driving produces repeated pulses of roughly 0.2 seconds each.
Time domain data captures peak particle velocity, dominant frequency, and event timing in one shot, making it the starting point for nearly every field assessment.
Frequency Domain Analysis (FFT)
The Fast Fourier Transform converts a time signal into a frequency spectrum, breaking a complex vibration signature into its component frequencies. NASA research applying FFT to spiral-bevel-pinion gears found that fault development shows up as changes across specific frequency components over time.
Gear-mesh vibration occurs at a fundamental frequency plus harmonics. A spike at a particular frequency, or the appearance of sidebands around it, can point to a specific mechanical element wearing out. FFT is how technicians pinpoint which part is failing, not just that something is wrong.
Envelope (Demodulation) Analysis
Bearing faults create weak, high-frequency impact pulses that often get buried in background noise. Envelope analysis, using FFT or continuous-wavelet processing, isolates those pulses so they become visible against low signal-to-noise conditions.
The demodulated signal maps to specific bearing defect families:
- BPFI — inner race faults
- BPFO — outer race faults
- BSF — rolling-element faults
- FTF — cage faults
Catching those defect signatures early is how teams stop bearing or gear wear from becoming a full failure and unplanned downtime.
Modal Analysis
Modal analysis identifies a structure's dynamic characteristics, specifically its resonant frequency, mode shape, and damping. ASME defines resonance as the point where a structure vibrates at unusually high amplitude, and that behavior shifts as operating conditions change.
On machinery, resonance sits alongside unbalance, misalignment, looseness, bearing faults, and gear faults as a condition vibration signature analysis can diagnose.
Near construction or blasting activity, modal analysis helps predict whether nearby sources might excite a building's natural frequency and cause disproportionate movement.
Peak Particle Velocity (PPV) & Seismic Waveform Analysis
PPV analysis measures ground vibration velocity and compares it against regulatory or structural safety thresholds. It's the backbone of construction, blasting, and infrastructure vibration compliance work.
USBM RI 8507 studied 76 homes and 219 production blasts and found that safe PPV depends on both frequency and construction type. Residential structures generally tolerate 0.5–2.0 in/s before damage risk rises.
Whole-structure resonances tend to sit around 4–12 Hz, with mid-wall resonances closer to 10–25 Hz.
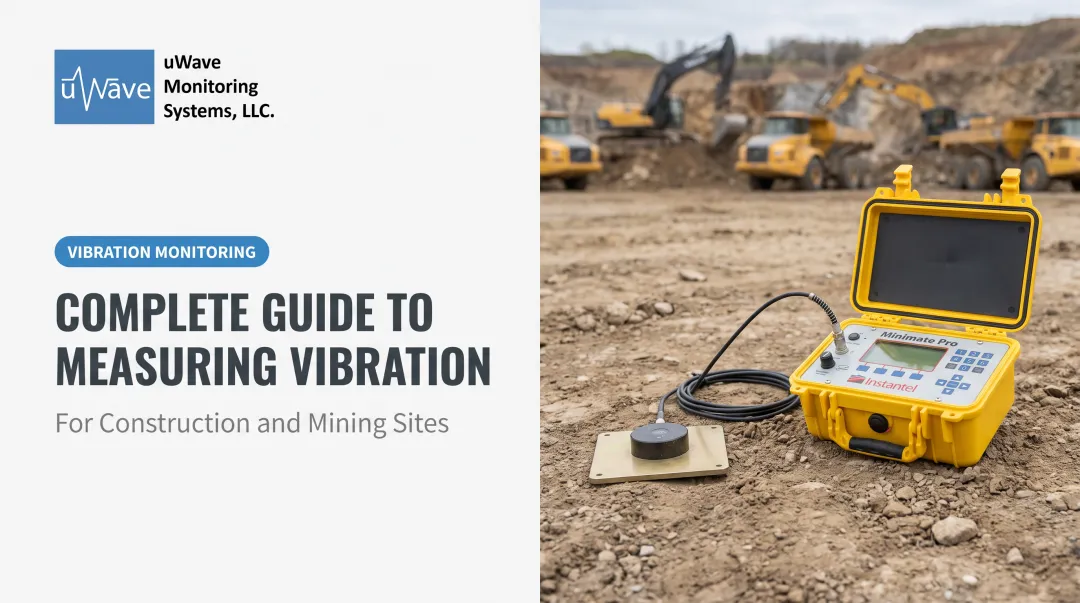
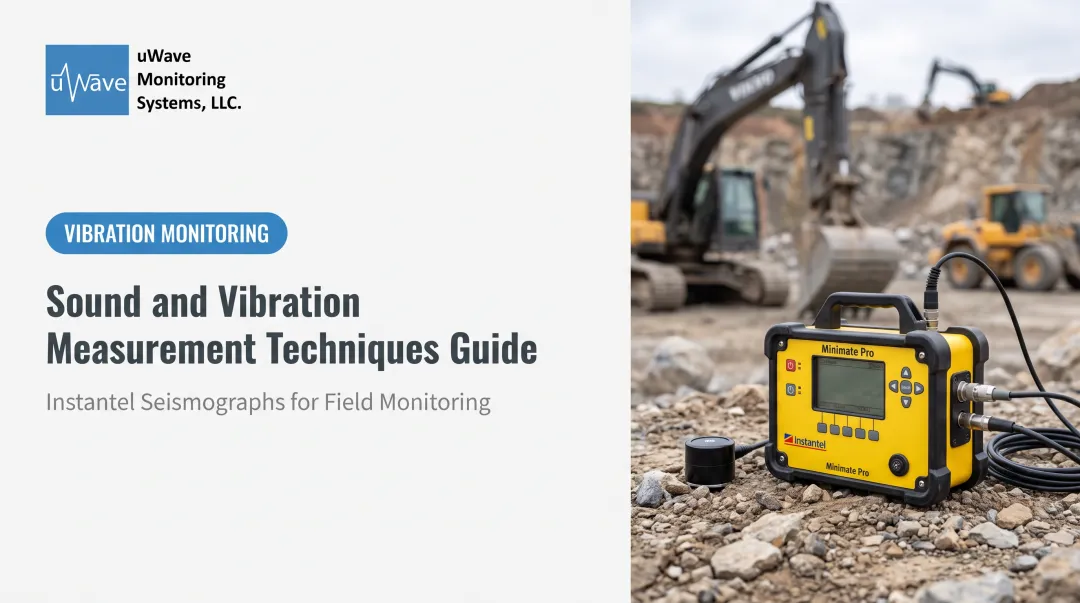
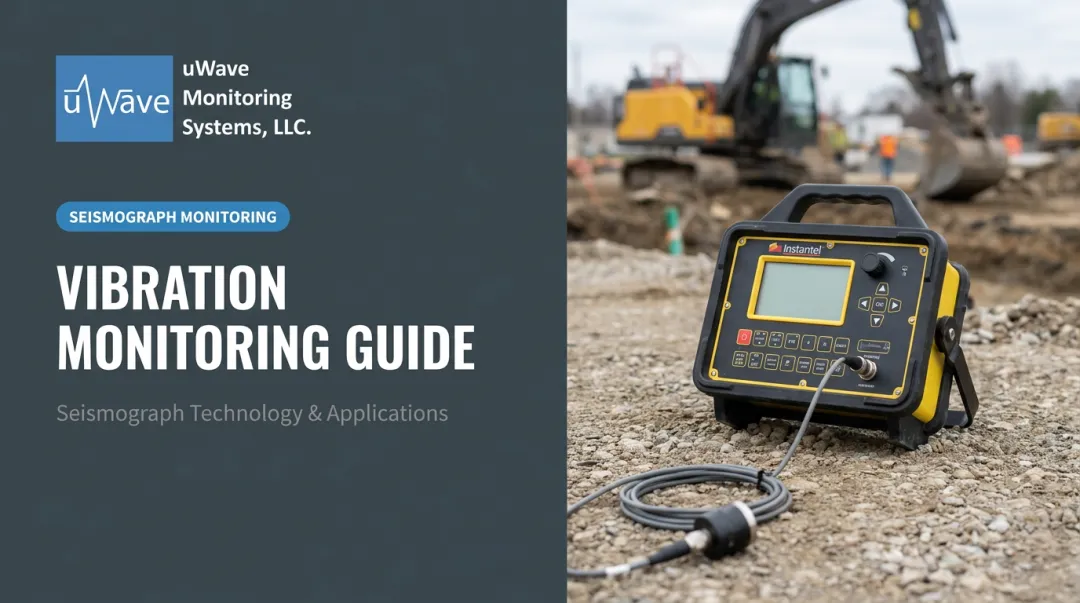
Seismograph-based systems handle this work in the field. Instantel units, for instance, capture ground-borne vibration in three perpendicular directions—the same directional recording federal blasting regulations require.
How Vibration Analysis Works – Step by Step
Running a vibration analysis program on an active job site or plant floor takes more than theory. Here's the practical sequence—and the mistakes that still trip up experienced teams, like skipping baseline data or leaving alerts unreviewed for days.
Step 1 – Define the Objective
Start by clarifying the goal: are you detecting equipment faults, or are you protecting a structure and staying within a regulatory vibration limit? The answer shapes every decision that follows, from sensor placement to which analysis technique you'll use.
Step 2 – Gather Inputs
Select sensors matched to the job:
- Triaxial ISEE geophone (2–250 Hz): covers roughly 95% of ground-vibration applications; supports cable runs up to 250 feet
- Accelerometers: better fit for rotating equipment work
- Sampling rate: some seismographs support 512 to 65,536 samples per second, depending on the fidelity you need
Step 3 – Organize & Prepare
Clean and filter raw data, then establish a baseline under normal operating or ambient conditions. Skipping this step is one of the most common failures in the field. Without a baseline, there's nothing to compare a spike against, and "normal" becomes a guess.
Step 4 – Apply the Analysis
Run the technique that fits your objective—time domain review for transient events, FFT for fault frequencies, or PPV for ground compliance.
Modern analyzer software handles most of the heavy lifting, but input quality from Step 2 still determines output quality.
Step 5 – Interpret Results
Compare readings against baselines, OEM specifications, or regulatory thresholds. Federal blasting rules under 30 CFR 816.67 offer a clear example of how these thresholds work in practice:
| Distance to Protected Structure | Maximum PPV | Scaled-Distance Factor |
|---|---|---|
| 0–300 ft | 1.25 in/s | 50 |
| 301–5,000 ft | 1.00 in/s | 55 |
| 5,001 ft or more | 0.75 in/s | 65 |
Source: 30 CFR 816.67, 2025 edition.
Readings that creep toward these limits flag a need for action, not just documentation.
Step 6 – Act & Review
Trigger an alert, schedule corrective maintenance, or pause construction activity. Then refine your thresholds based on what you learn. Vibration programs that never get revisited tend to drift out of sync with actual site or equipment conditions.
Example Walkthrough: Monitoring Vibration Near a Construction Site
Picture a pile-driving project 150 feet from an older brick structure. A crew places a seismograph at the structure's foundation and records ambient baseline vibration for a day before work starts.
Once pile driving begins, the unit monitors continuously and streams live data. As readings climb toward the project's compliance limit, an automated alert fires, giving the site supervisor time to pause and reassess before crossing the threshold.
Common mistakes: skipping the baseline step, or letting data sit unreviewed until the next morning.
Best practice: real-time alerts paired with a documented threshold everyone on the crew understands before work starts, not after a complaint comes in.
How uWave Monitoring Systems Can Help
Running the process above manually, especially across multiple active sites, gets unwieldy fast. uWave Monitoring Systems is built for that multi-site reality.
uWave specializes in the rental, sale, and service of Instantel seismographs, including the Micromate, Minimate Pro4/Pro6, Minimate Plus, and Blastmate III lines. The company also builds custom remote vibration and sound monitoring systems for construction, mining, quarrying, water infrastructure, and transit projects.
The uWave Project Manager platform covers the field-to-cloud workflow:
- 24/7 remote access to monitoring data without on-site downloads
- Automated email and text alerts when readings near configured thresholds
- Maintenance alerts that flag equipment issues before data gaps appear
- Customized reports for compliance documentation and project records
- Secure backup of historical monitoring records
For teams managing several sites at once, uWave's bulk monitoring packages and multi-unit purchase discounts make project-wide vibration analysis more practical than stitching together one-off rentals per site.
Tools like these keep multi-site programs manageable, but the analysis still needs human oversight. Thresholds, sensor placement, and monitoring cadence should be reviewed as equipment ages and project conditions change.
Frequently Asked Questions
What does vibration analysis do?
Vibration analysis measures vibration signals to diagnose equipment faults or assess ground and structural levels. Teams can then schedule maintenance or pause construction before minor issues escalate.
What is the difference between time domain and frequency domain analysis?
Time domain analysis reviews the raw waveform over time, ideal for catching transient events like impacts or blast pulses. Frequency domain analysis uses FFT to break the signal into a spectrum, pinpointing specific fault frequencies within rotating equipment.
How often should vibration analysis be performed?
Frequency depends on equipment criticality and project activity. Some sites use continuous remote monitoring; others run monthly route-based checks or event-specific monitoring during blasting or pile driving.
What equipment is used for vibration analysis?
Common tools include accelerometers, velocity and displacement sensors, and seismographs like Instantel's Micromate or Minimate Pro series, paired with analysis software. Many systems also incorporate sound and air-overpressure microphones for combined monitoring.
Can vibration analysis be used for construction and blasting monitoring?
Yes. Seismograph-based PPV analysis is specifically designed for this, monitoring blasting, pile driving, and heavy equipment vibration near sensitive structures to keep readings within regulatory or structural safety limits.
What industries rely on vibration analysis?
Mining and quarrying, heavy construction, water infrastructure, transit, and manufacturing all rely on it. Applications differ by sector, from blast compliance and structural protection to early fault detection on rotating assets.