Introduction
America's water infrastructure is aging faster than utilities can replace it. According to the ASCE Infrastructure Report Card, the U.S. has more than 2 million miles of underground transmission and distribution lines, with an average pipe life expectancy of 78 years — meaning a significant share of the network is already past or approaching its design limits.
The consequences aren't abstract. U.S. and Canadian systems experience roughly 260,000 pipe failures annually, costing around $2.6 billion per year in maintenance and repair. Water losses alone drain $6.4 billion in uncaptured utility revenue each year.
Real-time monitoring has moved from optional upgrade to operational necessity. Manual inspection cycles create data gaps that failures exploit. Modern continuous monitoring systems eliminate those gaps, giving operators, engineers, and construction project managers 24/7 visibility into conditions that determine whether a pipeline holds or fails.
This guide covers:
- What real-time water infrastructure monitoring tracks
- Which technologies power modern monitoring systems
- How construction vibration threatens buried pipes
- How to implement a monitoring program that protects assets and satisfies regulators
Key Takeaways
- Real-time monitoring continuously tracks hydraulic, structural, and environmental conditions without relying on manual inspection cycles
- Construction-induced ground vibration is a documented failure mechanism for buried pipes, not just a secondary concern
- Modern systems combine IoT sensors, SCADA, cloud platforms, and seismographic tools for 24/7 operator visibility
- Automated threshold alerts let operators intervene before small anomalies become expensive failures
- Equipment is available as rentals or purchases, making deployment practical for both permanent utilities and short-term construction projects
What Real-Time Water Infrastructure Monitoring Tracks
Real-time water infrastructure monitoring is the continuous, automated tracking of physical and environmental conditions across water system assets — pipelines, mains, pump stations, reservoirs, and treatment facilities — with data transmitted and analyzed as it arrives, not hours or days later.
This is broader than water quality testing alone. A complete monitoring picture covers four distinct data categories.
Hydraulic Parameters
Flow meters and pressure transducers placed at network nodes detect:
- Unexplained pressure drops — strong indicators of active leaks or pipe failures
- Pressure surges : signals of water hammer or sudden valve movements that stress pipe walls
- Unaccounted-for water loss : Bluefield Research estimates 87% of U.S. non-revenue water comes from real losses like leaks and bursts
Pressure zone mapping in real time lets operators pinpoint problem segments without shutting down entire network sections.
EPA Region 8 defines distribution pressure loss below 20 psi as a condition that may require immediate notification and a potential boil-water advisory. Automated monitoring systems are built to catch these threshold crossings the moment they occur.
Structural and Vibration Data
Ground-borne vibration from blasting, pile driving, vibratory compaction, and heavy equipment transit travels through soil and induces stress in buried pipes. Brittle cast iron mains, older concrete pipe, and mechanical couplings near depth transitions are especially vulnerable.
Continuous seismographic monitoring establishes pre-construction baselines and captures exceedance events that may have caused damage. That timestamped record supports both operational decisions and liability documentation.
Water Quality Indicators
Sensors for chlorine residual, turbidity, pH, and conductivity placed at strategic distribution points provide early warning of contamination intrusion or treatment process failures. A sudden turbidity spike or chlorine residual drop at a network node can trigger an alert within minutes, giving operators time to isolate the affected zone before consumers are exposed.
Asset and Operational Status
Pumps, valves, and control infrastructure can be monitored for run-hours, energy draw, and anomalous cycling patterns. Unusual behavior (an unexpected valve position, a pump cycling more frequently than normal) often signals a developing mechanical problem before any physical symptom is visible.
Why Real-Time Monitoring Is Critical for Water Infrastructure in 2026
The case for continuous monitoring rests on three converging pressures: infrastructure age, regulatory requirements, and the cost gap between reactive and proactive management.
The Scale of the Problem
The numbers make the case plainly:
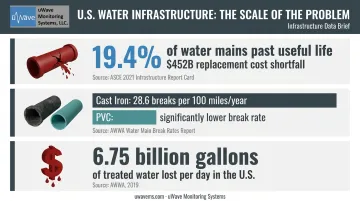
- 19.4% of installed water mains are beyond their useful life, representing a $452 billion replacement shortfall
- Cast iron mains — still common in older urban systems — fail at 28.6 breaks per 100 miles per year, nearly ten times the rate of PVC
- U.S. utilities lose 6.75 billion gallons of treated water per day — revenue that evaporates with every undetected leak
These aren't problems that periodic inspection can solve. A manual survey conducted quarterly creates a 90-day window where a small pressure anomaly can escalate into a full main break.
Regulatory Pressure Is Real and Accelerating
The Infrastructure Investment and Jobs Act directed over $26 billion toward drinking water through FY2026, but that funding carries compliance obligations. The America's Water Infrastructure Act (AWIA) requires community water systems serving more than 3,300 people to certify Risk and Resilience Assessments on a five-year cycle — with deadlines running through June 2026. The revised Lead and Copper Rule requires service line inventories and systematic replacement programs.
Real-time monitoring delivers the timestamped, auditable data records these frameworks demand — and provides continuous evidence of compliance between certification cycles.
The Cost of Waiting for Failure
Emergency response to a burst main — excavation, traffic management, service restoration, regulatory notification — costs multiples more than catching a pressure anomaly early. Proactive intervention on a small pressure anomaly costs far less than an emergency repair combined with a boil-water advisory and public liability exposure.
Workforce Realities
Roughly one-third of the water sector workforce is eligible to retire within the next decade. Automated remote monitoring reduces dependence on on-site personnel for routine data collection — maintaining consistent oversight even as utility staffing shrinks.
Core Technologies That Power Real-Time Monitoring Systems
Field Sensors and Instrumentation
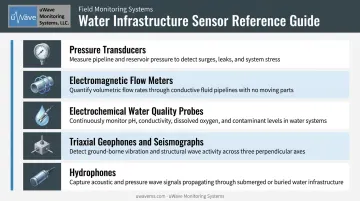
Sensor selection determines what a monitoring system can actually see. The main categories:
- Pressure transducers — detect hydraulic anomalies at network nodes
- Electromagnetic flow meters — measure volumetric flow and flag unaccounted-for losses
- Electrochemical water quality probes — track chlorine, turbidity, pH, and conductivity at distribution points
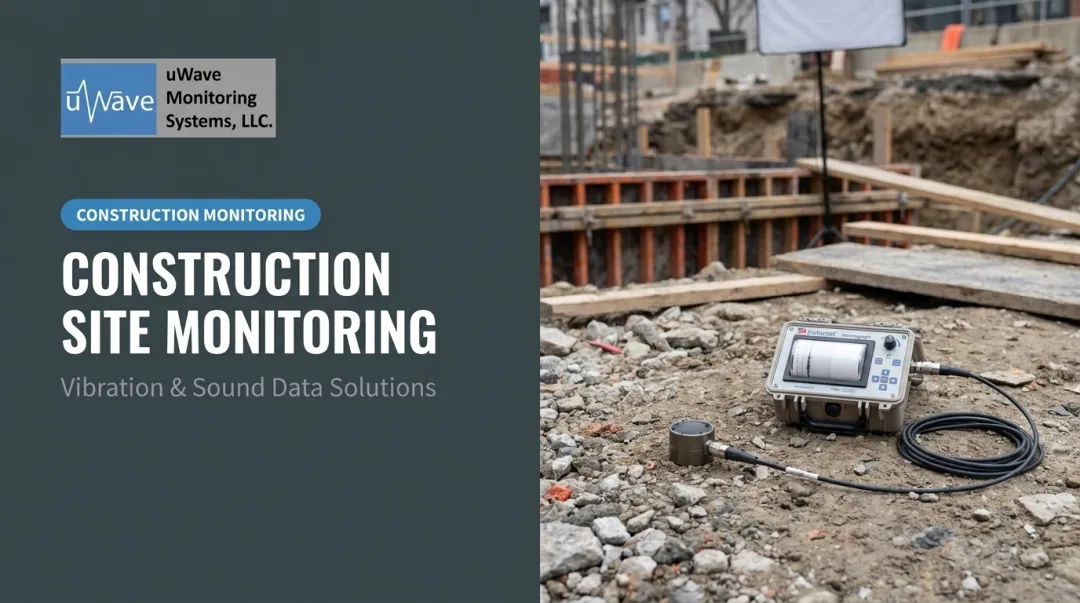
- Triaxial geophones and seismographs — measure ground-borne vibration in three axes, the foundation of structural vibration monitoring near buried infrastructure
- Hydrophones — measure pressure changes directly within pipelines; compatible with instruments like the Instantel Minimate Pro6
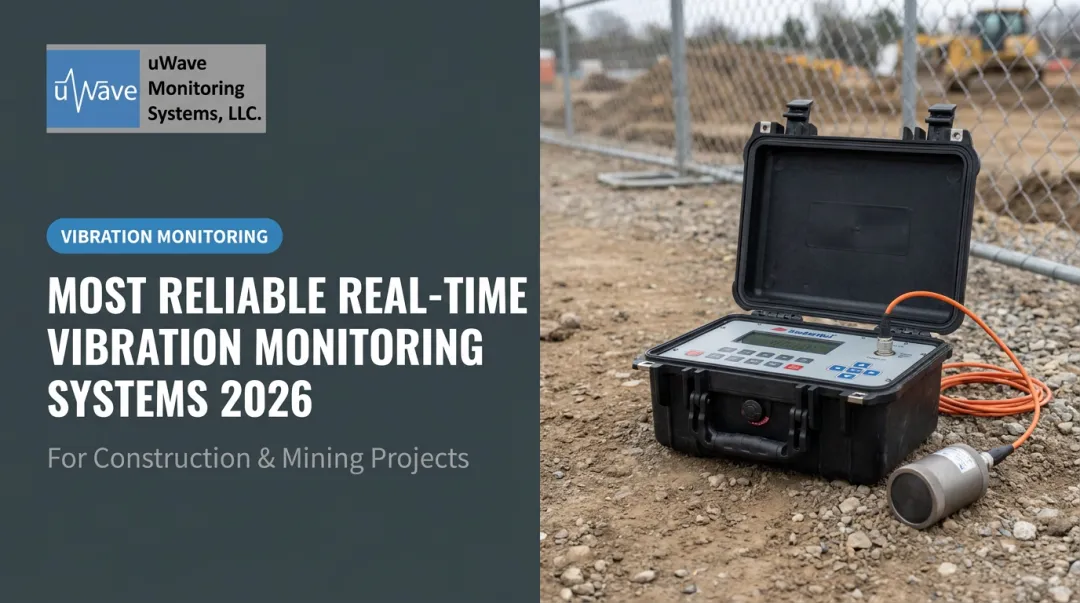
For construction-phase vibration monitoring near water mains, geophones are the primary sensor. The Instantel Micromate Plus — available for rental or purchase through uWave Monitoring Systems — is explicitly listed for water infrastructure and system upgrade applications, with a standard triaxial geophone measuring across a 2–250 Hz frequency range.
SCADA and Telemetry Systems
Supervisory Control and Data Acquisition (SCADA) systems aggregate sensor signals from across a network and transmit them to control centers. Remote Telemetry Units (RTUs) and data loggers in the field bridge physical sensors to the SCADA or cloud environment — handling local data logging, digital processing, and wireless transmission even at remote sites.
EPA guidance confirms that most utilities embarking on online monitoring already have some form of SCADA. Expanding an existing system is generally the most cost-effective path forward.
Cloud Platforms, Dashboards, and AI
Where SCADA handles local aggregation, cloud-hosted platforms handle the visibility layer. Operators access real-time dashboards from any device, configure custom alert thresholds, and receive automated email or SMS notifications when a parameter is breached. Data is securely backed up and available for compliance reporting without manual retrieval.
AI is rapidly becoming part of this layer. A 2023 ASCE survey of 49 large U.S. drinking-water utilities found that 24% had already used some form of AI, with 68% of non-users planning to explore it within five years — primarily for leak detection and water quality applications. Machine learning now handles pattern recognition in large sensor streams in practice, not just in pilots, identifying anomalies that fall within individual parameter limits but deviate from expected trends.
Protecting Water Infrastructure from Construction-Related Vibration
Construction activity near buried water infrastructure carries real risk, and the incidents confirm it. In August 2023, a contractor in Prince George, Virginia struck a water main, triggering a boil-water advisory affecting an entire subdivision. In February 2026, a water main ruptured in Frisco, Texas while a private construction crew was working on the line, resulting in a fatality and a regulatory investigation.
These aren't freak events. The CGA's 2024 DIRT Report recorded nearly 197,000 unique underground utility damages — with water and sewer work representing the leading work type involved.
How Vibration Damages Buried Pipes
Ground-borne vibration from pile driving, blasting, vibratory compaction, and heavy excavation equipment travels through soil and induces stress in buried pipe materials. Cast iron mains (already the highest-failure-rate pipe category) are particularly vulnerable at joints and elbows. Even sub-threshold events can accumulate micro-damage across a construction project's duration, setting up failures that appear weeks or months after work concludes.
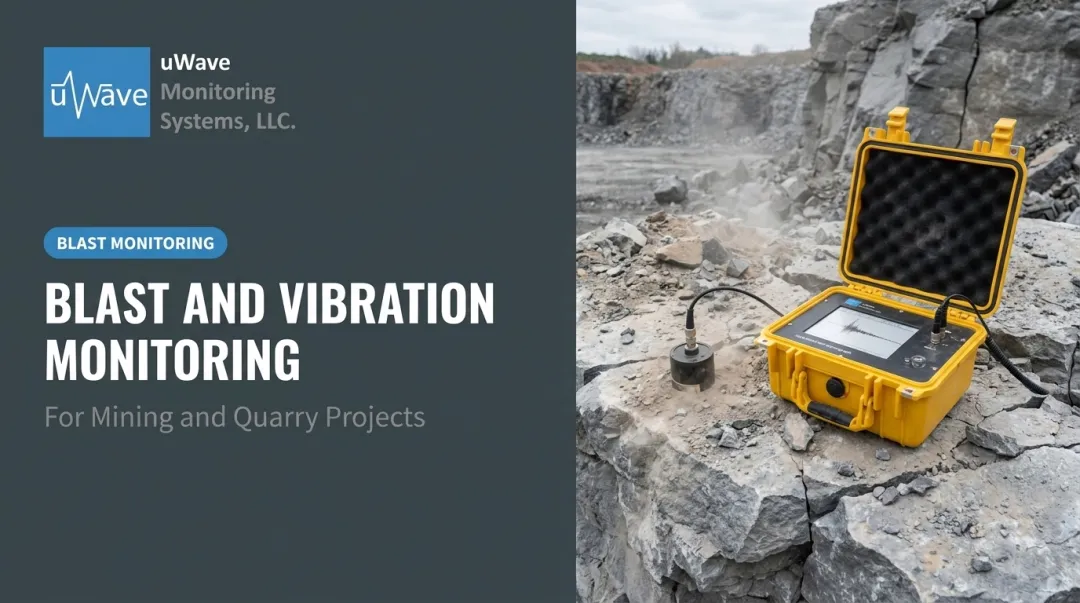
OSMRE blasting guidance establishes maximum allowable Peak Particle Velocity (PPV) limits for offsite structures: 1.25 in/s at 0–300 ft, 1.00 in/s at 301–5,000 ft, and 0.75 in/s beyond 5,001 ft. That said, project-specific engineering standards for buried pipe materials may set different thresholds. A 2022 construction vibration monitoring plan for a large Ottawa watermain, for example, set a warning level at 20–50 mm/s PPV with a stop-work exceedance at ≥50 mm/s.
Vibration Monitoring Protocols for Construction Projects
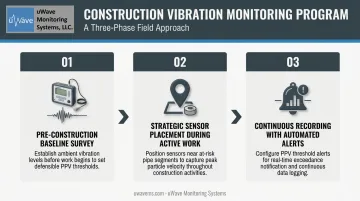
A defensible vibration monitoring program near water mains involves three phases:
- Pre-construction baseline survey — Deploy seismographic sensors to establish ambient ground vibration levels before any construction activity begins. This baseline defines what "normal" looks like and makes exceedance events identifiable.
- Strategic sensor placement during active work — Position sensors near at-risk pipe segments, particularly older cast iron mains, sections at depth transitions, and corroded segments, at distances informed by the construction method and soil conditions.
- Continuous or event-triggered recording with automated alerts — Configure threshold alerts so project managers and engineers receive immediate notification when PPV readings approach or exceed defined limits, enabling real-time work method adjustments.
Applying This in Practice
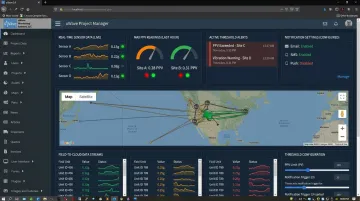
uWave Monitoring Systems deploys field-to-cloud vibration monitoring for water infrastructure projects using Instantel seismographs (Micromate Plus and Minimate Pro6), paired with V3 or V5 remote monitoring station enclosures. Each station runs on solar power with AGM battery backup and transmits data via 4G LTE to the uWave Project Manager cloud platform.
The platform's monitoring capabilities include:
- Automated PPV threshold alerts sent via email and SMS to project managers, engineers, and utility contacts the moment a limit is approached or breached
- Remote threshold adjustment via THOR software over cellular connection, no site visit required
- Pre-construction baseline assessment to capture ambient conditions before work begins and inform threshold configuration for the active phase
- Rental and purchase options to match project timelines, with rental packages eliminating upfront capital costs for defined-duration deployments
How to Implement a Real-Time Water Infrastructure Monitoring System
Step 1 — Define Monitoring Objectives and Asset Inventory
Start with what you're protecting and why. A water main in an active construction corridor has different monitoring needs than a treatment plant effluent point.
Map the assets and identify the highest-risk segments — older pipe materials, known corrosion areas, sections near planned excavation — then determine whether your primary concern is hydraulic performance, structural integrity, water quality, or all three.
This step also clarifies what data you need for operational decisions versus what regulators require for compliance documentation.
Step 2 — Select Sensors and System Architecture
Match sensor selection to monitoring objectives:
- Pressure transducers and electromagnetic flow meters at network nodes for hydraulic monitoring
- Triaxial geophones and seismographic instruments (Micromate, Minimate Pro) with remote station enclosures for vibration and structural monitoring
- Electrochemical probes at distribution sampling points for water quality
- Multi-channel instruments that handle vibration, overpressure, and sound simultaneously for combined applications
Decide on the ownership model. For permanent utility deployments, purchased systems amortize well over long operational periods. For construction-phase monitoring with a defined end date, rental packages provide the same field-to-cloud capability without capital commitment — and complete rental packages include sensors, cables, carrying cases, and cloud platform access.
Step 3 — Deploy, Configure Alerts, and Integrate Data
With sensors placed at network nodes, at-risk pipe segments, and asset interfaces, the focus shifts to configuration and integration. Get this sequence right before going live:
- Configure alert thresholds before work begins — not after the first anomaly appears
- Connect field instruments to the cloud platform or SCADA environment and verify data flow
- Establish maintenance and calibration schedules from day one
- Train personnel to interpret dashboards, respond to alerts, and use trend data for compliance reporting
- For vibration monitoring deployments, capture pre-construction baseline data before active work starts — that record is what makes exceedance events defensible
Frequently Asked Questions
What is the difference between water infrastructure monitoring and water quality monitoring?
Water quality monitoring tracks the chemical and biological condition of water — pH, turbidity, chlorine residual, contaminants. Water infrastructure monitoring tracks the physical condition and performance of system assets: pipes, pumps, valves, and mains, including pressure, flow, structural integrity, and vibration. Most modern platforms integrate both into a single operational view.
What parameters does real-time water infrastructure monitoring track?
Core monitored parameters include:
- Hydraulic: flow rate, pressure
- Structural/vibration: ground-borne PPV, pipe stress
- Asset status: pump cycling, valve positions
- Water quality: distribution point indicators
- Environmental: soil moisture and groundwater levels near at-risk buried segments
How does vibration monitoring protect buried water pipelines?
Seismographic sensors placed near at-risk pipeline segments continuously record ground-borne vibration levels during nearby construction. When PPV readings approach or exceed defined thresholds, automated alerts notify project managers immediately — enabling real-time work method adjustments. The timestamped event record also serves as documented evidence for liability protection and regulatory compliance.
What technologies are used in real-time water infrastructure monitoring systems?
Core components include field sensors (pressure transducers, flow meters, triaxial geophones, water quality probes), telemetry hardware (data loggers, RTUs, cellular modems), and cloud platforms that aggregate, visualize, and alert on incoming data. Instruments like the Instantel Minimate Pro integrate directly with cloud systems for continuous remote access.
Can real-time monitoring equipment be rented for short-term construction projects?
Yes. Rental packages — including seismograph instruments, remote monitoring enclosures, sensors, cellular modems, and cloud platform access — are practical for project-based deployments. They deliver the same field-to-cloud capability as permanent installations without capital expenditure.
How do automated alerts work in water infrastructure monitoring systems?
Operators configure threshold values for each monitored parameter — PPV limits, pressure floors, flow deviations. When a sensor reading crosses that threshold, the system automatically sends email and SMS notifications to designated personnel. This removes the need for manual dashboard monitoring and ensures the right people are notified the moment conditions require a response.