That's the problem with noise complaints: without data, "it's too loud" is just an opinion. Noise measurement and analysis turns that opinion into evidence — timestamped, defensible, and specific enough to hold up in front of a regulator or an angry neighbor.
The Federal Highway Administration has flagged construction noise near homes and businesses as a factor that needs active control and monitoring, warning that unaddressed community concerns can threaten project schedules. That's not a hypothetical. It's a documented risk factor on infrastructure jobs of every size.
This article breaks down how noise gets measured, how that data gets analyzed, and what a practical monitoring workflow looks like on an active job site.
Key Takeaways
- Noise is measured in decibels (dB) using a logarithmic scale, typically A-weighted (dBA) to reflect human hearing.
- Analysis requires more than one reading: Leq, Lmax, and trend data over time show what is actually happening on site.
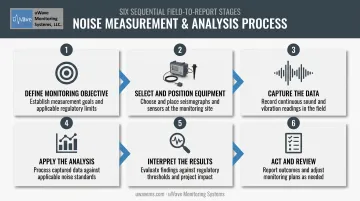
- A 6-step process (objective, equipment, capture, analysis, interpretation, action) converts raw dB readings into decisions.
- OSHA's 85 dBA action level and local noise ordinances often apply simultaneously on the same job site.
- Continuous, cloud-based monitoring catches spikes a one-time spot check would miss entirely.
What Is Noise Measurement and Analysis?
Noise measurement is the process of quantifying sound pressure levels (how loud something is) in decibels. Noise analysis is what comes next: interpreting those readings against regulatory thresholds, historical baselines, and trends to decide whether action is needed.
The two aren't interchangeable. A single 95 dBA reading means nothing on its own. Is that a five-second truck backup alarm or a sustained eight-hour exposure? That distinction is the entire point of analysis.
Where it gets used:
- Occupational safety: OSHA exposure limits for workers on job sites
- Environmental compliance: municipal noise ordinances near residential zones
- Construction and mining permits: boundary or nighttime limits tied to permit conditions
- Equipment condition monitoring: unusual noise signatures indicating mechanical wear
Two Ways to Collect the Data
Most projects rely on one of two approaches:
- Manual spot-check surveys: a technician visits the site with a handheld Class 1 or Class 2 sound level meter and records readings during a specific window.
- Continuous remote monitoring: an unattended unit logs data 24/7 and sends automated alerts when levels approach a threshold.
Under IEC 61672-1:2013, Class 1 meters carry tighter accuracy tolerances than Class 2 instruments, which matters when you're defending a compliance position rather than just getting a general sense of ambient noise.
Why Noise Measurement and Analysis Is Critical for Construction and Infrastructure Projects
Without measurement, a noise complaint becomes a "he said/she said" dispute. The resident says it was unbearable at 2 a.m. The contractor says the site was quiet. Nobody has data, so nobody wins, and the permit review drags on.
Documented noise data changes that dynamic entirely. Here's what it protects:
- Regulatory compliance — meets OSHA occupational limits and municipal noise ordinances simultaneously
- Worker hearing health — reduces employer liability tied to hearing-conservation obligations
- Legal defense — provides timestamped evidence to counter complaints or claims
- Proactive adjustments — flags issues before they become violations, not after
- Permitting support — gives regulators and stakeholders data instead of assurances
- Long-term trust — builds a track record with regulators across multi-phase projects
Toronto's bylaw enforcement office, for example, lists a $900 set fine for construction sound occurring during a prohibited period, a real cost that adds up fast across a project with recurring violations.
New York City takes a permitting angle instead, requiring after-hours authorization and a filed mitigation plan before work outside standard daytime hours can proceed. Either way, cities expect documented proof.
How Noise Is Measured and Analyzed – Step by Step
This is the practical workflow used on active industrial and construction sites, where equipment startup schedules and weather don't wait for a technician to show up.
Common mistakes to avoid:
- Skipping calibration checks before and after deployment
- Ignoring frequency weighting when the applicable standard requires dBA
- Failing to act on a threshold exceedance because nobody was watching the data
Step 1 – Define the Monitoring Objective
Before anything gets deployed, identify why you're measuring. Is this OSHA hearing-conservation compliance? A municipal ordinance tied to a permit? Equipment condition tracking? The objective determines which thresholds apply and which regulations govern the readings.
Step 2 – Select and Position Equipment
Choose a Class 1 meter for precision compliance work, a Class 2 unit for general assessments, or a continuous remote monitoring station for unattended logging. Position sensors per IEC 61672 guidance: placement affects accuracy as much as the instrument itself.
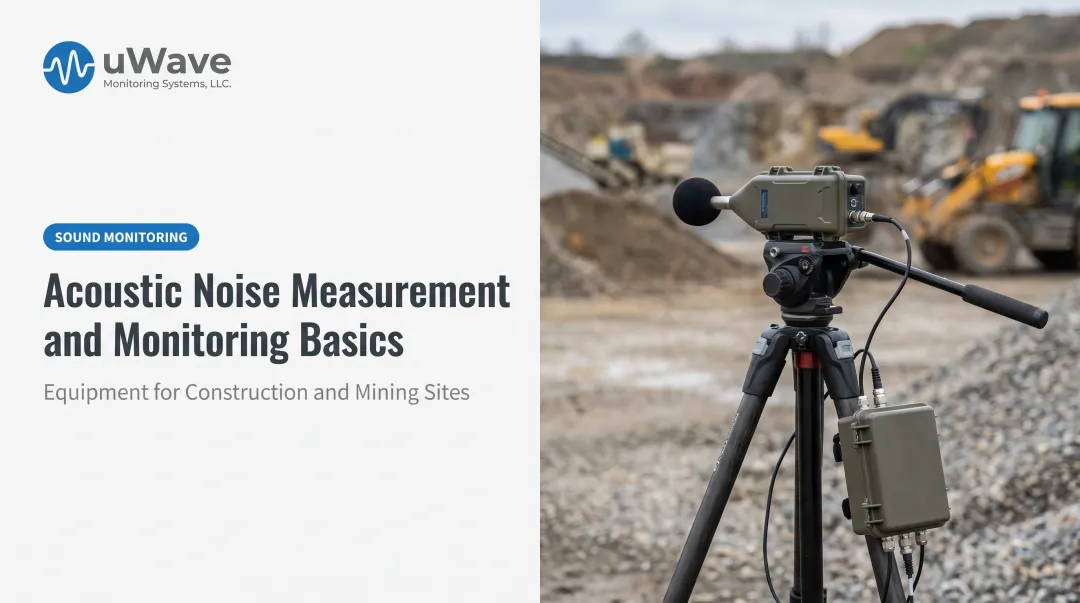
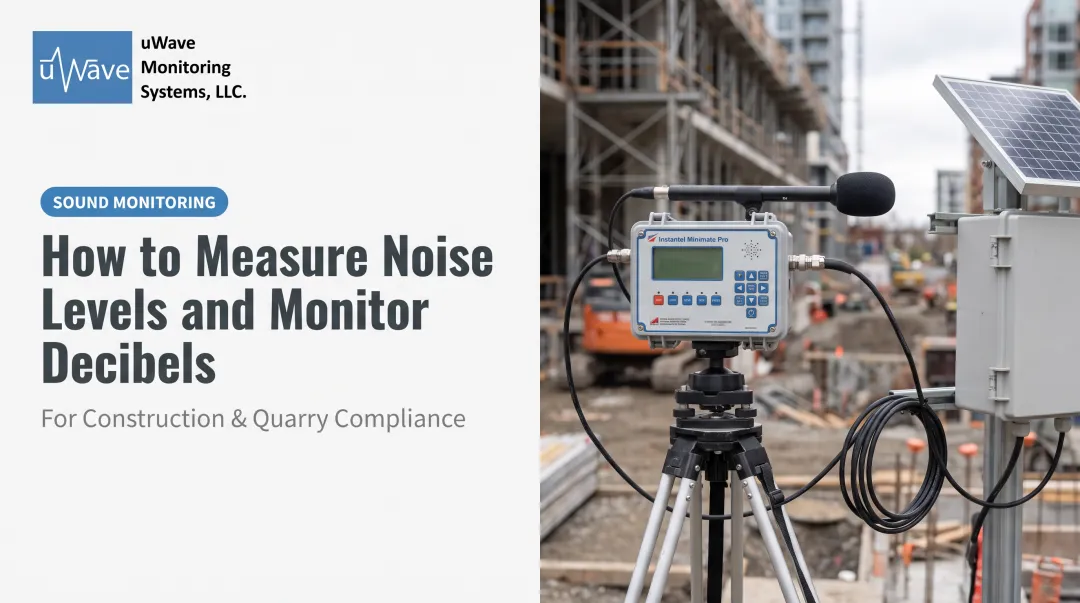
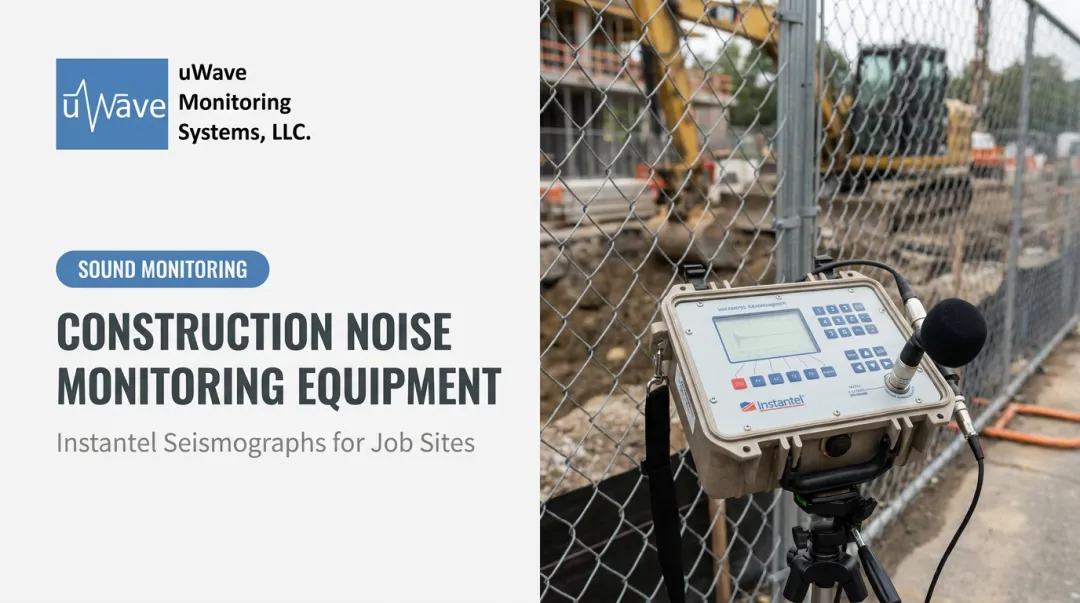
On the equipment side, systems like the Instantel Micromate or Minimate Pro4 pair a sound-level microphone with vibration channels, so a single unit can capture both at once. That setup is useful when pile-driving or blasting triggers noise and vibration concerns together.
Step 3 – Capture the Data
Record readings continuously or at set intervals, applying A-weighting (dBA) filters so the numbers reflect how human ears actually perceive loudness. A raw dB reading and a dBA reading of the same event can differ meaningfully, which is why dBA is the standard for hearing-safety and community-noise work.
Continuous logging closes a gap manual surveys can't: it doesn't miss the 3 a.m. spike because nobody was on-site to record it.
Step 4 – Apply the Analysis
Two metrics do most of the heavy lifting:
| Metric | What it tells you |
|---|---|
| Leq | Equivalent continuous sound level — an energy average that weighs louder moments more heavily |
| Lmax | The single highest level during one event, useful for isolating a startup or impact spike |
Compare both against baseline readings and the applicable regulatory threshold. Remember: decibels are logarithmic, so small numeric differences represent large changes in actual sound energy.
Step 5 – Interpret the Results
A number without context is useless. Is the Lmax spike a one-off event, a recurring pattern tied to equipment cycles, or an actual compliance breach? Trend data across multiple days answers that question far better than a single reading ever could.
Step 6 – Act and Review
When a threshold is crossed, automated alerts should trigger a response such as:
- Adjusting a startup schedule
- Repositioning equipment
- Installing a temporary barrier
Enclosures and shields can reduce noise by 10 to 20 dBA depending on design, according to FHWA nighttime construction noise guidance. Revisit thresholds periodically; a limit set at project start may need adjustment as work phases change.
Noise Analysis – Example Case Walkthrough
This scenario plays out across construction, mining, and infrastructure sites near sensitive receptors like homes or hospitals.
- Set the objective — Confirm compliance with a local nighttime noise ordinance limit at the residential property boundary.
- Deploy equipment — Calibrate a remote monitoring unit and position it at the property line, facing the noise source, before logging begins.
- Capture data — Run continuous dBA readings over several nights, including the early-morning equipment startup window.
- Analyze results — Compare Leq levels against the ordinance threshold. A recurring spike appears every morning during equipment startup, right at the edge of the allowed period.
- Take action — Shift the startup schedule later, install temporary barriers near the boundary, and configure automated alerts so future spikes get flagged immediately.
The mistake this setup avoided: a single daytime spot-check would have shown a quiet site. Equipment would not have been running during the early-morning startup window, so the exceedance would have gone undetected.
How uWave Monitoring Systems Can Help
uWave Monitoring Systems builds Field-to-Cloud sound and vibration monitoring systems for heavy construction, mining, quarrying, water infrastructure, and transit projects. The cloud-hosted platform automates the steps above: capturing continuous data, applying thresholds, and pushing real-time email and text alerts when noise levels approach a limit.
For equipment, uWave offers the Instantel Micromate and Micromate Plus, four-channel units that combine a triaxial geophone with a sound-level or air-overpressure microphone. The MinimatePro4 supports professional sound monitoring via an Instantel Type 1 Sound Level Meter.
Series III units like the Minimate Plus and Blastmate III handle peak-only sound monitoring from 50–110 dB(A). Those fit limited applications such as pile driving, not full compliance work.
What this setup delivers:
- Faster response through automated alerts instead of manual spot-checks
- Higher accuracy from properly positioned, calibrated remote sensors
- Flexible access through rental, purchase, or bulk monitoring packages with volume discounts
- 24/7 remote project access with secure data backup for defensible compliance records
- Customized reporting, including THOR-configured event exports, that turns raw dB(A) data into audit-ready documentation
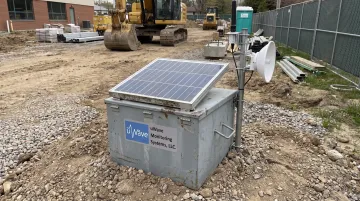
Field stations typically run on a solar-powered enclosure with a cellular gateway (uWave currently recommends the Sierra Wireless RV55) for continuous uptime without needing site power.
Noise measurement is not a box you check at project kickoff. Sites change, equipment cycles shift, and thresholds sometimes need revisiting. Ongoing monitoring keeps projects ahead of complaints instead of reacting after the fact.
Frequently Asked Questions
How is noise measured in decibels, and what does a difference of 1 dB or 10 dB mean?
Decibels use a logarithmic scale. A 1 dB change is barely perceptible, while a 10 dB increase is about ten times the sound intensity but only roughly double the perceived loudness. A jump from 20 dB to 30 dB therefore feels modest even though the sound energy is ten times greater.
What do decibel levels like 70 dB and 100 dB correspond to in everyday sounds?
About 70 dBA is typical of a busy street or vacuum cleaner. Power tools often sit in the 85–90 dBA range, and a busy construction site can reach 100 dBA or higher depending on the equipment in use.
What is the difference between dB and dBA?
dB is a raw measure of sound pressure. dBA applies an A-weighting filter that reflects how the human ear perceives different frequencies, which is why dBA is the standard for hearing-safety and community-noise assessments.
What is the difference between Class 1 and Class 2 sound level meters?
Class 1 meters offer tighter accuracy tolerances, suited to critical compliance and legal work. Class 2 meters are accurate enough for general industrial and community noise assessments at a lower cost.
What noise level is considered safe or compliant on a construction site?
OSHA sets an 85 dBA, 8-hour time-weighted average as the action level triggering hearing-conservation requirements. Local ordinances often set separate, lower limits for property-line or nighttime noise, so check both federal and local rules.
How does remote, continuous noise monitoring differ from a one-time sound survey?
A one-time survey captures a single snapshot during a chosen window. Continuous remote monitoring logs data around the clock and catches intermittent spikes (such as early-morning startups) that a spot-check would likely miss.