Many project teams focus entirely on the blast or the pile driver, treating background noise as an afterthought. That's a mistake. Without properly measuring and accounting for seismic noise, teams risk false alarms, missed events, and compliance reports that don't hold up under scrutiny from regulators or frustrated neighbors.
A 2021 peer-reviewed study on anthropogenic seismic noise found that human-generated vibration above 1 Hz varies dramatically by time of day and economic activity. That variability is exactly what makes construction sites tricky to monitor correctly.
This guide covers what seismic noise actually is, the tools that detect it, the techniques used to analyze it, and how teams turn that data into defensible compliance decisions.
Key Takeaways
- Seismic noise above 1 Hz typically comes from human activity, while natural microseisms cluster below 1 Hz.
- Sensor choice, placement, and coupling directly affect whether readings reflect true ground motion or local artifacts.
- Power Spectral Density (PSD) analysis, compared against global noise models, is the standard way to baseline a site.
- Stakeholder-ready compliance docs come from automated cloud alerts and customized reporting—not raw feeds alone.
- Pick partners that cover rental, purchase, and remote monitoring design—not hardware alone.
What Is Seismic Noise and Why It Matters on Project Sites
Seismic noise is the persistent, low-amplitude ground vibration a seismograph records continuously underneath the event you care about. That event might be a blast, a pile strike, or heavy equipment operation. The noise never fully disappears—it's always layered under the signal.
Two broad categories drive this noise:
- Natural sources — ocean-generated microseisms below 1 Hz, wind loading on structures and vegetation, and flowing water in nearby rivers or streams
- Anthropogenic sources — vehicle traffic, industrial machinery, generators, and construction equipment itself
Cultural noise from traffic and machinery mainly travels as high-frequency surface waves, typically 1–10 Hz and higher. That energy usually attenuates within a few kilometers, so construction and mining teams watch the high-frequency band most closely.
Why This Matters for Compliance
Unaccounted-for background noise can mask smaller vibration events entirely. It can also skew peak particle velocity (PPV) readings if a sensor picks up local surface artifacts instead of true ground motion. Get either of these wrong, and a compliance report built on that data becomes shaky ground for defending your project to a regulator or an upset property owner.
Essential Tools for Seismic Noise Monitoring
Choosing the right equipment starts with matching sensor type to the question you're trying to answer.
Geophones vs. Accelerometers
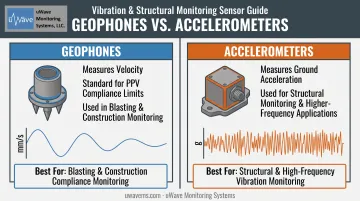
Geophones are velocity-based sensors and remain the standard choice for ground vibration monitoring tied to PPV compliance limits, since most blasting and construction ordinances are written directly in velocity terms. Accelerometers, which measure ground acceleration, are typically brought in for structural monitoring or higher-frequency applications.
Instantel's Minimate Pro, available in 4-channel (Pro4) or 6-channel (Pro6) configurations, supports that flexibility. It is the only unit in the common product lineup with documentation explicitly supporting accelerometer connectivity alongside high-frequency geophones, hydrophones, and sound-level microphones. Sample rates range from 512 to 65,536 samples per second.
Sensitivity also matters. Global noise models like Peterson's New High-Noise and New Low-Noise curves show the amplitude range instruments may need to resolve, from quiet bedrock sites to noisy urban ground. Pick the wrong sensitivity range for your site and you either drown in noise or miss the signal.
Digitizers, Data Loggers, and Field-Ready Seismographs
Digitizers convert analog ground motion into digital records. Sampling rate and corner frequency both matter. A unit that samples too slowly misses high-frequency events entirely. A frequency band that is too narrow cuts off part of the noise spectrum you need for accurate baselining.
Ruggedized field seismographs handle this job on site. Instantel's lineup covers the range:
- Micromate — four channels (triaxial geophone plus one air-overpressure/sound channel), ISEE 2–250 Hz or DIN 1–315 Hz geophone options, ranges up to 10 in/s
- Minimate Pro — the multi-sensor option described above
- Blastmate III — a compact Series III unit typically paired with an ISEE geophone (2–250 Hz) and a linear microphone rated 2–250 Hz and 88–148 dB
uWave Monitoring Systems offers all three for rental or purchase, and builds custom enclosures for harsh field conditions where temperature swings, moisture, or theft risk are concerns.
Field-to-Cloud Connectivity and Arrays
Remote, cloud-connected systems let teams check readings without driving out to each sensor. A typical field-to-cloud setup pairs a seismograph with a cellular modem, powered by a solar panel and battery through a charge controller, transmitting data to a hosted platform in near real time.
For larger or geometrically complex sites, multiple synchronized sensors (an array) capture how vibration propagates across distance. Single-station setups remain the norm for most standard construction projects. GPS timing equipment becomes relevant when arrays need to align traces from geographically dispersed instruments.
Core Techniques for Measuring and Analyzing Seismic Noise
Raw ground motion data isn't useful until it's processed correctly. The standard workflow follows a consistent path.
From Raw Signal to Frequency Domain
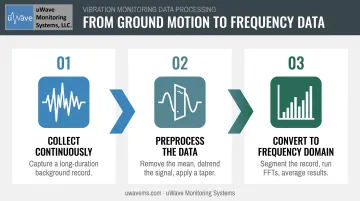
- Collect continuously — background noise needs a long enough record to characterize properly, not just a snapshot.
- Preprocess the data — remove the mean, detrend the signal, and apply a taper (commonly a 10% sine taper) to reduce spectral leakage before transforming.
- Convert to the frequency domain — split the record into overlapping segments, run FFTs, and average the results into a usable spectrum.
Power Spectral Density: The Standard Metric
PSD is the go-to method for quantifying background noise across frequencies, expressed in decibels for easy comparison. A common approach bins periods in 1/8-octave intervals and power in 1 dB steps, then builds a probability-density function from those bins.
Measured PSD values are compared against Peterson's reference curves:
- New High-Noise Model (NHNM) and New Low-Noise Model (NLNM) — used to judge whether a site's ambient noise is typical, elevated, or unusually quiet
- Important distinction — these are noise-level references, not vibration compliance thresholds. Don't confuse the two.
HVSR for Site Characterization
The Horizontal-to-Vertical Spectral Ratio (HVSR) method uses a single three-component sensor to estimate a site's fundamental ground resonance frequency. It's a passive technique—no active vibration source required—so it's useful for pre-construction site characterization.
Reading the Trends
Two patterns show up consistently in the data:
- Diurnal variation — anthropogenic noise tends to run higher during working hours and drop overnight
- Geology-driven differences — sedimentary sites can amplify certain frequencies well beyond what bedrock sites show, sometimes exceeding 20 dB at longer periods in water-saturated sediment
Once a source is identified, mitigation is straightforward:
- Relocate the sensor
- Add insulation
- Switch sensor types to improve reliability
Best Practices for Sensor Placement and Reducing Interference
Good analysis starts with good data, and good data starts with where you put the sensor.
Siting recommendations drawn from ISEE's field practice guidelines include:
- Keep sensors away from high-traffic areas, running equipment, and loose surface material whenever the site layout allows
- Avoid placing sensors on driveways, walkways, or slabs when a more representative location is available
- Use undisturbed soil or compacted fill; loose fill and unconsolidated soil can distort readings
Coupling matters just as much as location. ISEE's guidance ties coupling method to expected acceleration:
- Below 0.2g: no burial or attachment needed
- Between 0.2g and 1.0g: burial or attachment preferred
- Above 1.0g: firm attachment or burial required
Proper burial typically means a hole at least three sensor-heights deep, with the unit spiked at the bottom and soil compacted back around it.
Finally, don't set it and forget it. Routine equipment checks catch sensor drift, low battery, or connectivity drops before they compromise a record. uWave's cloud platform flags maintenance issues like modem power and cellular signal strength automatically, so problems surface before they become gaps in the compliance record.
Turning Seismic Noise Data into Actionable Compliance Decisions
Accurate background noise baselines only matter if they translate into decisions your project can defend.
Meeting Regulatory Limits
Federal surface-coal mining rules under 30 CFR 816.67 set maximum peak particle velocity (PPV) by distance from the blast:
| Distance from blast | Max PPV |
|---|---|
| 0–300 feet | 1.25 in/s |
| 301–5,000 feet | 1.00 in/s |
| Beyond 5,000 feet | 0.75 in/s |
An alternative frequency-dependent chart is also permitted. State and local rules can differ — Maryland, for instance, caps ground vibration at 2 in/s.
Whatever the governing limit, teams need a properly coupled, time-associated waveform to back up their PPV reading, not just a peak number.
Automated Alerts and Reporting
Manually checking a monitor for exceedances doesn't scale, and it's slow. uWave's cloud-hosted service pushes automated email and text alerts the moment a threshold is approached or exceeded, cutting response time and supporting proactive outreach to nearby residents before a complaint even comes in.
Customized reports then translate raw vibration, sound, and air overpressure data into documentation regulators, clients, and neighbors can actually read, drawing on waveform and histogram exports rather than raw numbers alone.
Scaling Without Adding Staff
The uWave Project Manager platform bundles 24/7 remote project access, automated alerts, and secure data backup. Heavy construction, mining, quarrying, and transit teams can manage compliance without someone physically checking a sensor every day.
For larger sites, bulk monitoring packages and multi-unit purchase discounts make deploying several synchronized sensors across a project cost-effective.
Choosing the Right Seismic Noise Monitoring Partner
Not every equipment provider offers the same depth of support. Gaps usually show up at the worst time: mid-project, when a sensor drops offline.
Evaluate potential partners on:
- Equipment reliability and calibration support: Annual calibration is standard practice for Instantel seismographs, so ask how the provider tracks and manages that schedule
- Rental and purchase flexibility: Short projects often favor rental, while ongoing multi-site operations may lean toward purchase
- Responsiveness of remote communications support: A field-to-cloud system is only as good as the support behind it when connectivity issues crop up
Sector experience counts too. Noise environments and compliance needs differ significantly between a quarry, a transit tunnel, and an urban water infrastructure upgrade. A provider who's worked across heavy construction, water infrastructure, urban development, and transit projects understands those differences firsthand.
uWave Monitoring Systems specializes in Instantel seismograph rental, sales, and service, paired with remote monitoring design support and custom enclosure design for field conditions. That combination of equipment access and monitoring guidance is worth weighing against providers who only sell hardware and leave the setup to you.
Frequently Asked Questions
What is the difference between seismic noise and construction vibration monitoring?
Seismic noise is the background ground vibration always present at a site, from traffic, wind, or natural sources. Construction vibration monitoring tracks specific events like blasting or pile driving against that noise baseline for compliance purposes.
What tools are used to measure seismic noise on a construction site?
Primary tools include seismographs with geophones for velocity readings, accelerometers for structural or high-frequency work, and cloud-connected data loggers for remote review. Instantel units like the Micromate and Minimate Pro cover most construction applications.
How often should seismic monitoring equipment be calibrated or serviced?
Annual calibration is the standard recommendation for Instantel seismographs and sensors, though exact intervals depend on manufacturer guidance and project duration. Routine maintenance alerts help flag battery or connectivity issues between formal service visits.
Can weather conditions affect seismic noise readings?
Yes. Wind and rain can raise mid- to high-frequency background noise for hours or days, and atmospheric pressure changes can affect longer-period readings. Account for weather when interpreting elevated baselines.
Should a construction project rent or purchase seismic monitoring equipment?
Short-term or single projects generally favor renting, while ongoing multi-site operations often benefit more from purchasing, especially with multi-unit discounts available. The right choice depends on project duration and how many sites need simultaneous coverage.
How do I know if my monitoring site has too much background noise for reliable readings?
Compare your measured PSD values against standard high- and low-noise models like the NHNM and NLNM. If readings stay elevated relative to those benchmarks, review sensor placement and coupling before relying on the data.